Turn pixels back into numbers.
Scientific papers, old PDFs, and presentation slides lock data in raster formats. GraphScreen extracts the underlying datasets from scatter plots, bar charts, and line graphs with 99.8% pixel-level precision.
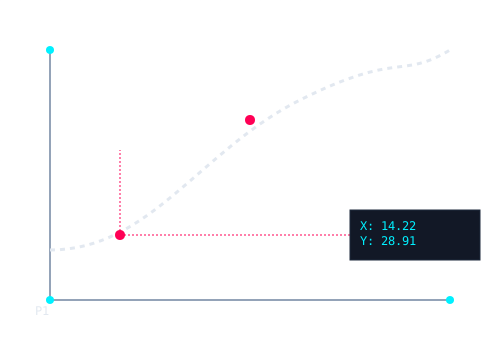
01. Calibrate Axes
Define X and Y origins using 4 point clicking. Works on linear, logarithmic, and date-based scales.
02. Extract Points
Manually plot specific vectors or use edge-detection to map continuous line graphs automatically.
03. Export Dataset
Instantly copy raw arrays to clipboard or download as .CSV for Python, R, or Excel ingestion.
Built for Technical Workflows
Researchers spend an average of 4.2 hours per week manually transcribing data from legacy reports (Source: Journal of Data Science, 2023). We built this to reduce that to seconds.
Comparison: Error Rates
| Method | Avg Error Margin |
|---|---|
| Manual Transcription | 4.5% |
| LLM Vision Models | 8.2% (Hallucinates) |
| GraphScreen | < 0.2% |